Traffic volume is a vanity metric. It’s a bold statement, so let’s clarify. The iGaming market is regulated, so success isn’t defined by how many users visit your site, but by Yield. You need to attract players who deposit, remain active, and generate net revenue. To build a scalable operation, operators must move beyond surface-level data and master the unit economics of the player lifecycle.
Acquisition Metrics: Quality Over Volume
Acquisition is not merely about sign-ups; it is about securing First Time Depositors (FTDs) at a cost that allows for future profitability. If the top of the funnel is filled with low-intent traffic, downstream metrics will inevitably collapse.
Acquisition is more than just getting users to sign up. It’s about securing First Time Depositors (FTDs) at a cost that allows for future profitability. These first-touch metrics set the foundation for your entire marketing ROI. If the top of the funnel is filled with low-intent traffic, downstream metrics might collapse. And every subsequent step becomes exponentially more difficult and expensive.
Cost Per Acquisition (CPA)
CPA measures the aggregate cost to acquire one depositing player (not just a registrant). It’s a foundational metric for budget management.
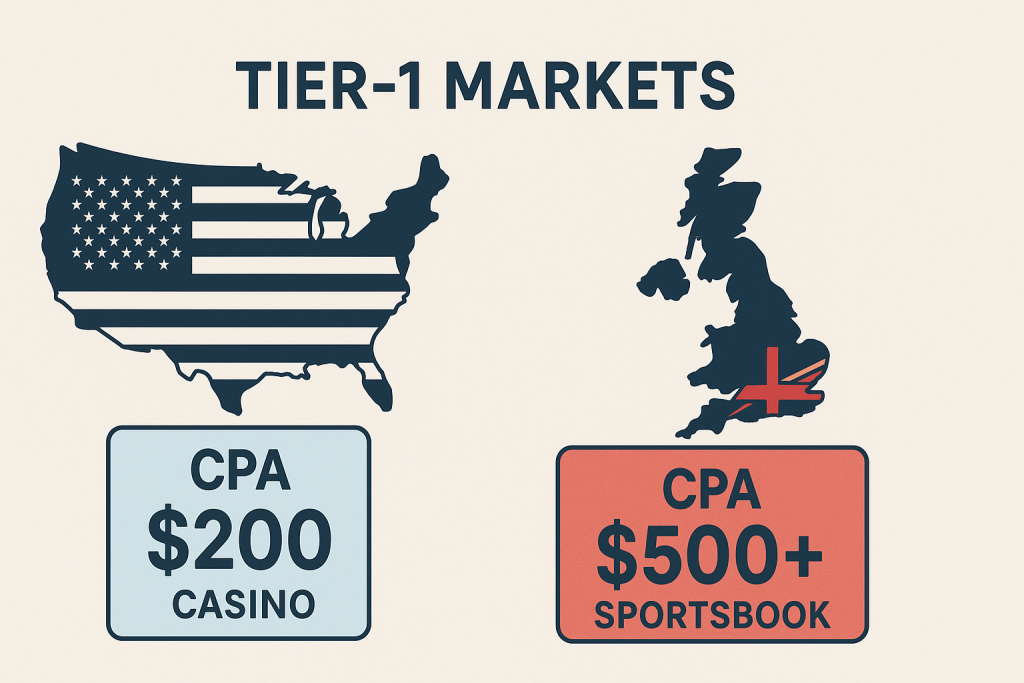
Industry Benchmark: In top markets (US, UK), CPA rates frequently range from $200 to over $500 depending on the vertical (Casino vs. Sportsbook). Always segment your CPA by geo and campaign to identify your most profitable channels.
The Trap: A low CPA (50−80) often signals low-quality traffic (e.g., “bonus hunters”) who churn immediately after depleting a welcome offer. Smart operators segment CPA by source to ensure they aren’t overpaying for low-value cohorts.
⭐️ Acquiring a low-value player cheaply is not a long-term victory. The goal is to balance CPA with the potential future value of the player and to understand the quality of the acquisition.
First Time Deposit (FTD) Rate
The FTD is a critical conversion point. It measures the percentage of registered users who commit capital. While registrations are a good start, the FTD represents the first real financial engagement a player has with your platform.
If you have high registrations but low FTDs, you likely have friction in your KYC (Know Your Customer) or Payment Gateway processes. Studies show that up to 25% of users drop off due to complex verification or declined transactions.
This metric is an indicator of traffic quality. At Axionus, we focus on FTD conversion rates to validate affiliate intent because they directly reflect the effectiveness of our SEO strategies in targeting players. A healthy FTD rate means your funnel is working efficiently.
Retention Metrics: Keeping Players in the Game
With acquisition costs at record highs, the leaky bucket approach is financial self-destruction. Data suggests that increasing player retention rates by just 5% can increase overall profits by 25% to 95%.
Cohort Retention (D1, D7, D30)
Track retention by cohorts (groups of users who joined on the same day, for example, Day 1, Day 7, and Day 30 retention). A healthy mobile casino app should aim for Day 1 retention of 25-30%. If Day 30 retention drops below 3-5%, your LTV will hardly cover your acquisition costs. Monitor “Redeposit Rates” specifically.

A player who returns to play is good; a player who returns to pay is valuable:
- High retention indicates that your platform offers a compelling experience, fair odds, and valuable promotions that keep players coming back for more.
- A steady decline shows issues with onboarding, game selection, or customer support that need immediate attention.
Churn Rate & Drivers
Churn Rate is the opposite of retention. It measures the percentage of players who stop using your platform within a given timeframe.
High churn can bleed your marketing budget dry, as you are constantly spending to replace lost players. In iGaming, the primary drivers of churn are:
- Payment friction & slow withdrawals.
- A poor UI leads. With 70-80% of iGaming activity on mobile devices, it leads to abandonment.
- Bonus fatigue & unclear wagering requirements.
Monetization Metrics & Unit Economics
Not all players are created equal. Monetization metrics help you understand the revenue-generating potential of your player base so that you focus your efforts on the most valuable segments.
Distinguish between ARPU (Active Users) and ARPPU (Paying Users)
ARPU provides a snapshot of how much revenue, on average, each active user generates in a specific period. It’s calculated by dividing total revenue by the number of active users.
ARPU is easily skewed by “Whales” (VIPs). In many operations, the top 5% of players generate 80% of revenue. Always segment ARPU by VIP levels to get an accurate picture of your general player base health.
Lifetime Value (LTV)
LTV projects the total net profit a player contributes over their entire relationship with your brand. A high LTV indicates you are acquiring the right players and keeping them engaged for a long time.
Your LTV:CAC ratio should be at least 3:1. Example: If it costs $150 to acquire a player (CPA), their LTV must eventually exceed $450 to cover operational overhead and generate profit.
⭐️ Use predicted LTV (pLTV) to bid higher on traffic sources that historically bring in loyal players, rather than bidding on cheap volume.
Profitability Metrics: Look at NGR, Not GGR
Ultimately, every marketing effort must translate into profit. These metrics cut through the noise and show you the actual financial health of your operation.
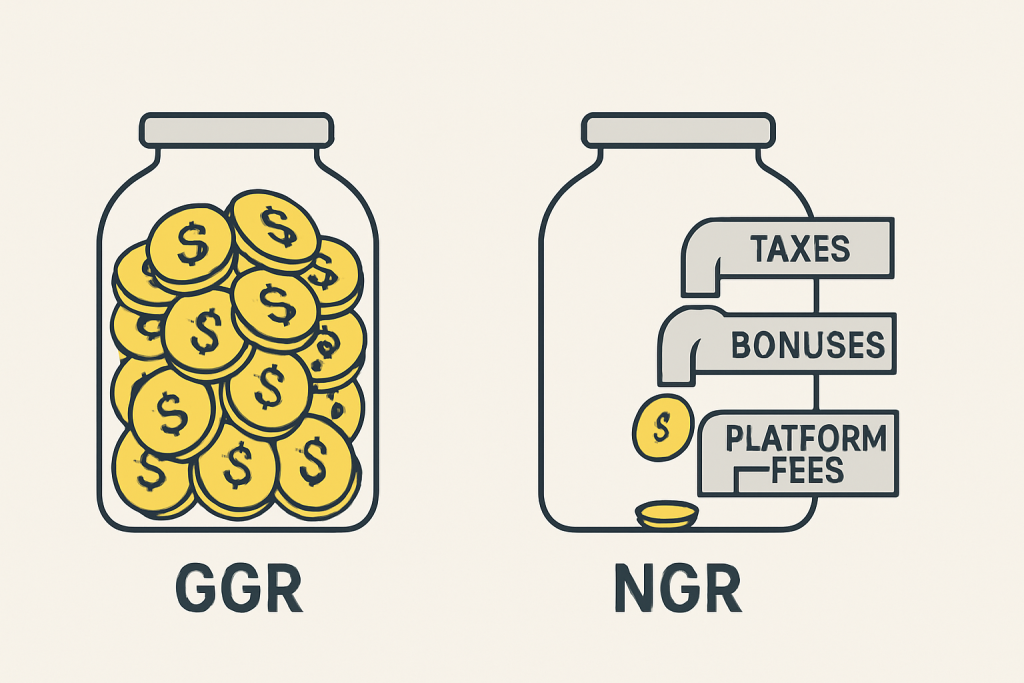
GGR vs. NGR
Gross Gaming Revenue (GGR): Total Bets — Total Payouts. This is a vanity number for internal hype.
Net Gaming Revenue (NGR): The actual money left in the bank. Formula: GGR — (Bonuses + Commissions + Payment Fees + Taxes).
In regulated markets like New York or parts of Europe, tax rates can eat 20% to 51% of GGR. Ignoring taxes in your ROI calculation will lead to bankruptcy.
Return on Investment vs. Return on Ad Spend (ROAS)
ROI measures the profitability of your marketing spend. Calculated as (NGR – Marketing Cost) / Marketing Cost, it tells you how much profit you generate for every dollar spent.
Instead of generic ROI, you can track ROAS. If you spend $1,000 on ads, how much NGR did that cohort generate in Month 1? Aim for 100% ROAS break-even within 6 to 9 months. If it takes longer than 12 months to earn back your ad spend, your cash flow will likely suffocate your growth.
How Retention Drives LTV and ROI
The logic is simple. When you increase player retention, you extend the time they spend on your platform. A longer player lifespan directly leads to more deposits and wagers, which in turn elevates their LTV. With a higher LTV, the same acquisition cost (CPA) now generates a greater ROI.
The most successful iGaming brands, and the affiliates who work with them, understand this dynamic. They invest in SEO and content strategies that attract qualified players predisposed to long-term engagement, creating a virtuous cycle of profitability.
Align your partnerships with player profiles that historically show the highest LTV, not just the lowest CPA. Contact us to learn more about iGaming traffic acquisition.